Vector Plot
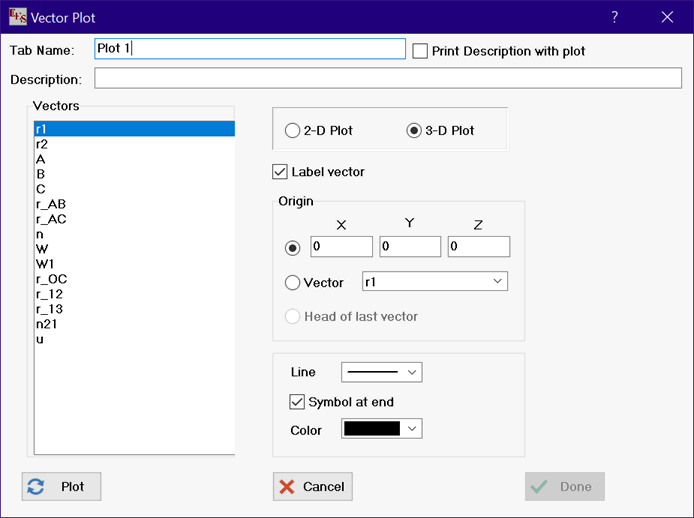
The Vector Plot option is enabled after one or more vectors have been defined using the $Vector or $Vector2D directive. Both 2D and 3D vector plots can be constructed, depending on the setting of the radio button control at the top.
Vectors are plotted one a time Select the vector from the list on the list on the left. Select the origin (i.e., the coordinates at the tail of the vector). Then click the Plot button. The option to use the Head of last vector as the origin becomes available after plotting the first vector. You can continue to plot additional vectors by repeatedly selecting the vector from the list and clicking the Plot button.
The Undo plot button deletes the last plotted vector.
The Label vector check box controls whether an identifying label is shown for each vector.
2-D plots will automatically update to the current date if the Auto Update check box is selected.
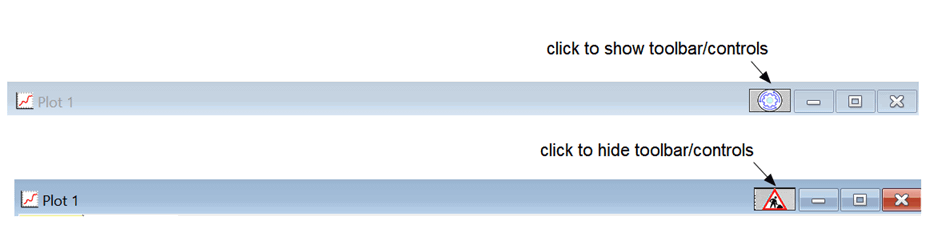
The Show 3-D Controls determines whether the controls will be visible when the plot is created. The controls can be later shown or hidden by clicking the left mouse button on the icon at the right of the title bar (shown below) or by right-clicking on blank space within the 3-D plot.
If the Add Directive check box is checked, a $VectorPlot directive will be inserted into the Equations window at the cursor location.
Click the Done button when all of the vectors are plotted or click Cancel to exit the dialog without creating a plot.